Headline findings
Active Nation: How many are participating
43% of pupils participated in organised sport outside of the curriculum three or more times per week (Future Generations Indicator 38). This has increased by 3-percentage-points since 2022.
Everyone: Who is participating
There is a 16-percentage-point difference in participation in organised sport outside of the curriculum three or more times per week between the least and most deprived areas. This gap has increased by 2-percentage-points since 2022 and 4-percentage-points since 2018.
Lifelong: Participation trends, and what's in demand
- On average, pupils reported demand for 10 sports.
- 84% of pupils said they wanted to do at least one sport that they don’t already do
Enjoyment: How do pupils feel when taking part in sport
55% of pupils said they enjoyed sport in Community Sport Clubs ‘A lot’, compared to 51% of pupils enjoying PE and Active Lessons, 51% of pupils enjoying Other Settings like the park or garden, and 31% of pupils enjoying School Sport Clubs ‘A lot’.
1. Introduction
The School Sport Survey is one of the largest, per capita opportunities in the world for young people to have their say on sport. In 2026, 122,000 pupils responded, from 1,000 schools and is our largest survey to date. The survey took place from the 13th of April to the 17th of July 2026.
The School Sport Survey is a national, online survey of pupils from years 3 to 11. Survey links are provided to every school in Wales and shared with pupils in the classroom. Guidance is also provided to teachers to assist their pupils, should they need to.
The survey captures attitudes, behaviours and opportunities for young people in sport. The survey is key to understanding who, where, and how often young people participate in, and have a demand for, sport.
Teachers are also offered the opportunity to share their views on school sport provision and the support they need to deliver it.
The results of the survey allow Sport Wales, schools, local authorities, sports and the wider sector to shape the future of sport, in line with the voices of young people.
This report contains a summary of key data that can help to better understand the sporting landscape for young people across Wales, providing a base of evidence from which to shape policy and practice.
The data has been presented in line with the Vision for Sport in Wales.
2. Active Nation: How many people are participating
The Vision for sport in Wales is to create an active nation, with as many people as possible inspired to be active through sport.
The following section explores a range of data, looking at participation and provision, to help build a better understanding of sporting activity levels and opportunities for young people in Wales.
2.1 National participation:
Across Wales, 98% of pupils took part in at least one sport in the last academic year, equating to over 301,000 pupils.
Participation varies by setting:
- 86% (263,000) of pupils participated in sport in PE or Lesson Time
- 39% (119,000) of pupils participated in sport in School Sport Clubs
- 62% (191,000) of pupils participated in sport in Community Sport Clubs
- 80% (244,000) of pupils participated in sport Somewhere Else
2.2 National frequency of participation
National Indicator 38 under the Well-being of Future Generations (Wales) Act 2015 tracks the percentage of people participating in sporting activities three or more times a week.
For children and young people, weekly participation in organised sport outside of the curriculum is used to track progress against the indicator. This refers to School Club and Community Club sport. Throughout this report it is shortened to ‘Club Sport’.
In 2026:
- 38% (117,000) of pupils participated in club sport less than once per week
- 9% (29,000) of pupils participated in in club sport once per week
- 10% (30,000) of pupils participated in club sport twice per week
- 43% (130,000) of pupils participated in club sport three or more times per week
Compared with 2022, the proportion of pupils participating in club sport three or more times per week has increased by 3-percentage points, however the proportion reporting no regular participation also increased by 3-percentage points.
2.3 National frequency of participation in a community club setting
55% (168,000) of pupils took part in sport in a community club setting at least once a week in the last academic year. This is similar to 2022.
The most popular sports participated in through community sport clubs at least once per week were:
- Football - 22% (68,000) pupils participate weekly
- Swimming – 11% (33,000) pupils participate weekly
- Rugby – 9% (29,000) pupils participate weekly
- Running or Jogging - 8% (26,000) pupils participate weekly
- Dance - 7% (20,000) pupils participate weekly
2.4 Curricular provision of PE:
During the 2025-26 academic year, teachers reported an average of 83 minutes of curricular PE was provided in Primary Schools across Wales each week. An average of 103 minutes was reported for Secondary Schools.
Table 1: Average curricular minutes of PE provided per week, by sector.
| School type | 2018 | 2022 | 2026 |
|---|---|---|---|
| Primary Schools | 99 minutes | 93 minutes | 84 minutes |
| Secondary Schools | 95 minutes | 93 minutes | 103 minutes |
2.5 Factors influencing the curricular and extracurricular sport offer
Teachers told us that ‘The sport facilities available at the school or in the community’ was the most important factors that influence which sports are offered during curricular and extracurricular sessions.
Table 2: Factors influencing curricular and extracurricular sport offers
| Factor | Curricular Sport Offer | Extracurricular Sport Offer |
|---|---|---|
| The sport facilities available at the school or in the community | 87% | 71% |
| Access to the necessary sport equipment | 85% | 64% |
| Staff skills | 82% | 71% |
| Pupil preference | 50% | 43% |
| Opportunities to compete locally | 44% | 23% |
| Staff capacity | 50% | 49% |
| Previous staff training | 33% | 23% |
| Staff preferences | 37% | 44% |
| Additional support | 17% | 11% |
| Historical precedence (i.e., we've always done it) | 19% | 10% |
| Other | 6% | 10% |
3. Everyone: Who is participating
The vision is for everyone. From people who don’t see themselves as sporty to people who win medals.
This section explores participation and frequency of participation by geography and demographics, examining similarities or differences across these groups to ensure the benefits of sport reach all young people across Wales.
3.1 Gender
47% (71,000) of boys took part in club sport three or more times a week, compared to 39% (57,000) of girls.
A similar pattern was observed in 2022 when 43% of boys and 36% of girls took part in club sport three or more times a week.
Pupils were able to report their gender as non-binary in 2026. 33% (1,000) of non-binary pupils, and 29% (1,000) of pupils who preferred not to report their gender, participated in club sport three or more times per week.
Graph 1: Frequency of participation in organised sport outside of the curriculum, by gender.
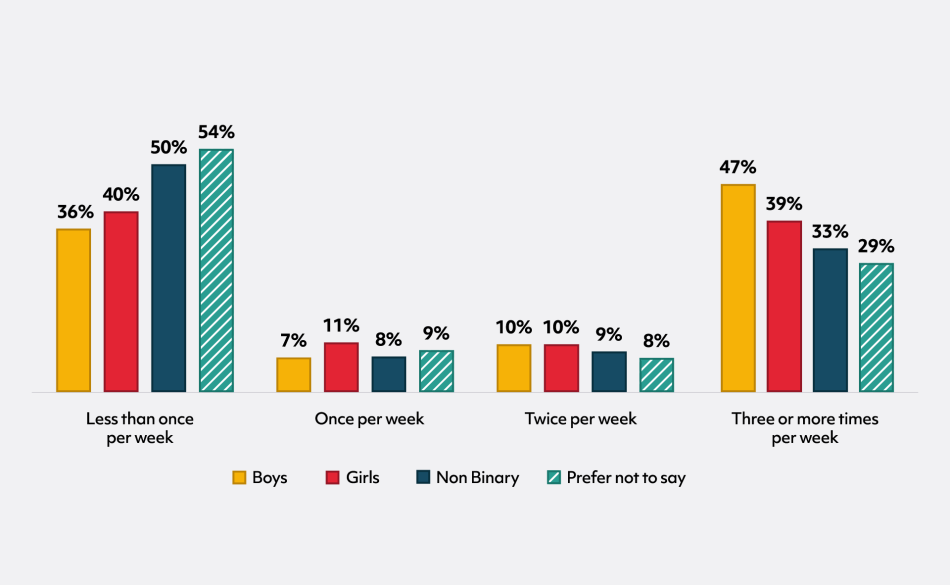
Description of graph 1
The percentage of pupils participating less than once per week was:
36% for boys
40% for girls
50% for non-binary pupils
54% for pupils who preferred not to say
The percentage of pupils participating once per week was:
7% for boys
11% for girls
8% for non-binary pupils
9% for pupils who preferred not to say
The percentage of pupils participating twice per week was:
7% for boys
11% for girls
8% for non-binary pupils
9% for pupils who preferred not to say
The percentage of pupils participating three or more times per week was:
47% for boys
39% for girls
33% for non-binary pupils
29% for pupils who preferred not to say
3.2 Disability and learning difficulties
39% (25,000) of pupils with a disability participated in club sport three or more times per week, compared to 45% (83,000) of pupils without a disability.
Graph 2: Frequency of participation in organised sport outside of the curriculum, by disability.
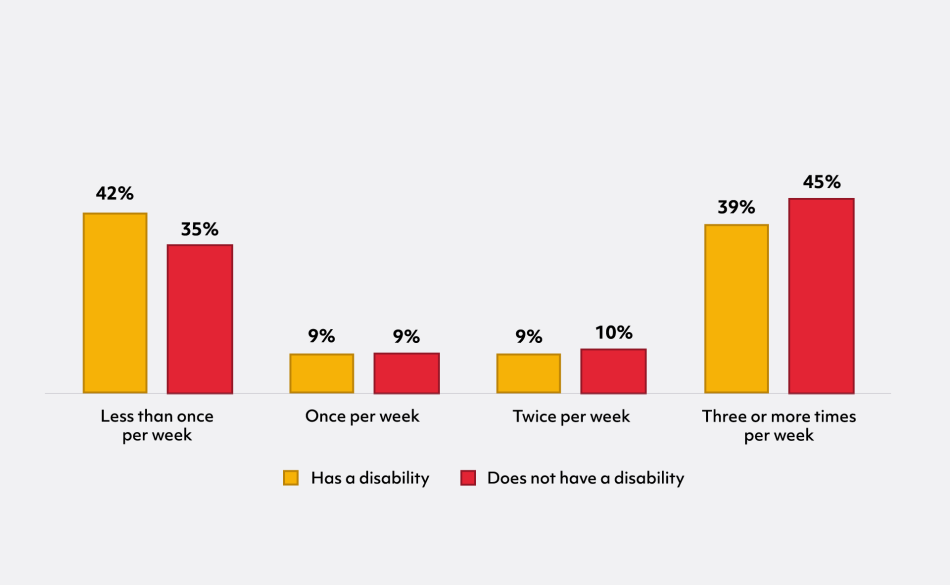
Description of graph 2
The percentage of pupils participating less than once per week was:
42% for pupils with a disability
35% for pupils without a disability
The percentage of pupils participating once per week was:
9% for pupils with a disability
9% for pupils without a disability
The percentage of pupils participating twice per week was:
9% for pupils with a disability
10% for pupils without a disability
The percentage of pupils participating three or more times was:
39% for pupils with a disability
45% for pupils without a disability
40% (12,000) of pupils with a learning difficulty participated in club sport three or more times per week, compared to 44% (101,000) of pupils without a learning difficulty.
Graph 3: Frequency of participation in organised sport outside of the curriculum, by learning difficulty.
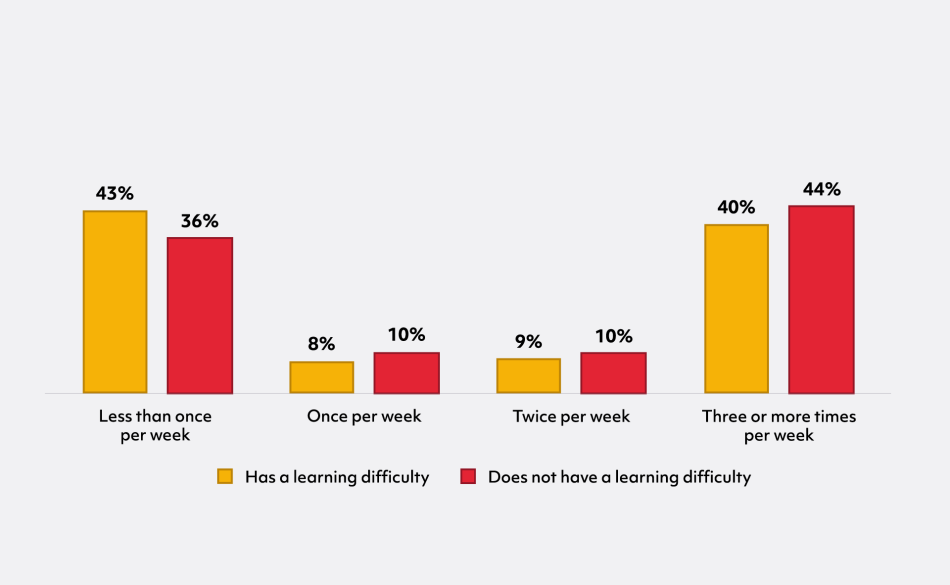
Description of graph 3
The percentage of pupils participating less than once per week was:
43% for pupils with a learning difficulty
36% for pupils without a learning difficulty
The percentage of pupils participating once per week was:
8% for pupils with a learning difficulty
10% for pupils without a learning difficulty
The percentage of pupils participating twice per week was:
9% for pupils with a learning difficulty
10% for pupils without a learning difficulty
The percentage of pupils participating three or more times was:
40% for pupils with a learning difficulty
44% for pupils without a learning difficulty.
The 2026 School Sport Survey also asked a series of questions about schools’ opportunity, skills and resources available to deliver PE, sport and physical activity to pupils with additional learning needs.
- 87% of schools said pupils with additional learning needs have the opportunity to participate in Sport, PE lessons and physical activity all of the time.
- 86% of schools said they have accessible spaces to deliver activities inclusively.
- 79% of schools said staff are confident in adapting activities and tasks to include disabled pupils and pupils with additional learning needs.
- 65% of schools said they use additional people or support staff to support inclusion.
- 56% of schools said they have equipment that enables inclusion.
3.3 Ethnicity
45% (5,000) of pupils from Mixed or Multiple ethnic groups participated in club sport three or more times per week, compared with 34% (2,000) of pupils from Other ethnic groups.
Table 3: Participation in organised sport outside of the curriculum three or more times a week, by ethnicity and Welsh language
| Ethnicity | Percentage | Number of pupils |
|---|---|---|
| White | 44% | 104,000 |
| Mixed or Multiple ethnic group | 45% | 5,000 |
| Asian, Asian Welsh or Asian British | 35% | 4,000 |
| Black, Black Welsh, Black British, Caribbean, or African | 41% | 4,000 |
| Other ethnic group | 34% | 2,000 |
3.4. Welsh Language
30% (18,000) of pupils who said they speak Welsh very well participated in club sport three or more times per week, compared with 18% (4,000) of pupils who said they do not speak Welsh.
Table 4: Participation in organised sport outside of the curriculum three or more times a week, by Welsh language ability
| Speaks Welsh | Percentage | Number of pupils |
|---|---|---|
| Very well | 30% | 18,000 |
| A fair amount | 24% | 13,000 |
| A little | 23% | 24,000 |
| Just a few words | 19% | 13,000 |
| Does not speak Welsh | 18% | 5,000 |
Pupils who said they could speak a little Welsh, a fair amount of Welsh, or speak Welsh very well were asked whether they usually speak Welsh when they do sport.
Among Welsh-speaking pupils, 14% (39,000) reported that they usually speak Welsh when participating in sport, while 86% (244,000) reported that they do not usually speak Welsh when participating in sport.
3.5 Geography
Participation in club sport three or more times per week differs between the West Wales and Gwent Sport Partnership Regions.
- In West Wales, 45% (30,000) pupils participate three or more times per week
- In Mid Wales, 44% (8,000) pupils participate three or more times per week
- In Central South Wales, 43% (42,000) pupils participate three or more times per week
- In North Wales, 41% (27,000) pupils participate three or more times per week
- In Gwent, 40% (24,000) pupils participate three or more times per week
3.6 Socioeconomic deprivation
Within the School Sport Survey, Free School Meal (FSM) is used as a measure of socioeconomic deprivation. Pupils in FSM Quartile 1 represent the least deprived pupils, and FSM Quartile 4 represent the most deprived pupils.
In 2026:
- 51% (34,000) pupils in FSM Quartile 1 participated in club sport three or more times per week
- 44% (36,000) pupils in FSM Quartile 2 participated in club sport three or more times per week
- 40% (32,000) pupils in FSM Quartile 3 participated in club sport three or more times per week
- 35% (25,000) pupils in FSM Quartile 4 participated in club sport three or more times per week
There was a 16-percentage-point difference between pupils in the most deprived quartile (FSM4) and those in the least deprived quartile (FSM1) in the proportion who participated in club sport three or more times per week.
This difference has increased since 2022 where a 14-percentage-point difference was observed between the least and most deprived.
4. Lifelong: Participation trends, and what’s in demand
The vision is for life. It responds to the needs of people at different stages of their life. This section explores different factors that may impact young people’s participation in sport at different stages of their life.
4.1 Frequency of participation by year group
Participation amongst Year 5-6 pupils was highest compared to all other year groups, with 46% (32,000) pupils participating in club sport three or more times per week.
Graph 4: Participation in organised sport outside of the curriculum three or more times a week, by school year groups.
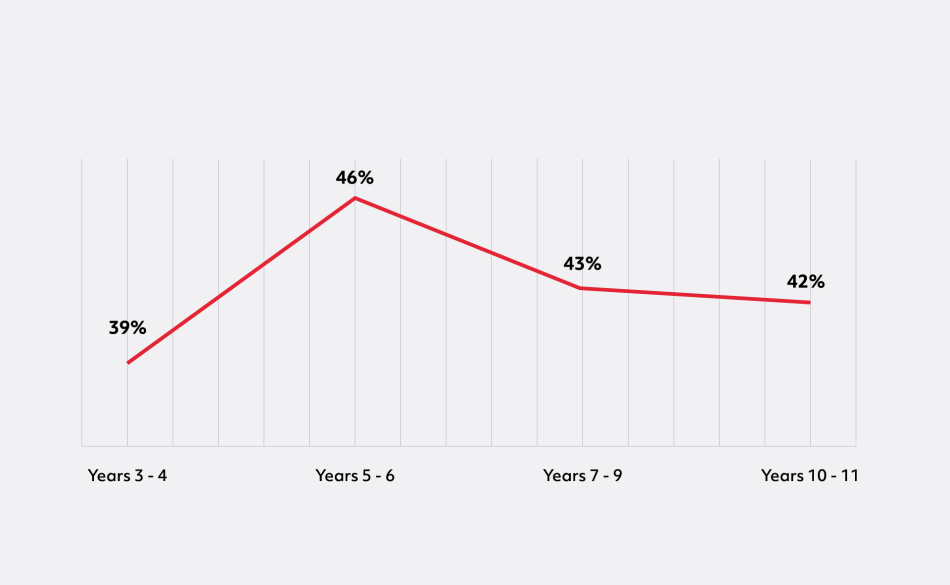
Description of graph 4
The percentage of pupils participating three or more times was:
39% for pupils in Years 3 and 4
46% for pupils in Years 5 and 6
43% for pupils in years 7, 8 and 9
42% for pupils in Years 10 and 11
4.2 Pupils’ experience of PE and Active Lessons
The school Curriculum for Wales aims to support learners to become confident, healthy and ready to learn for life. PE and Active lessons can contribute to these aims:
- 47% (131,000) of pupils said PE and Active Lessons made them feel ‘Very’ Confident.
- 53% (150,000) of pupils said PE and Active Lessons made them feel ‘Very’ Healthy.
- 44% (125,000) of pupils said PE and Active Lessons made them feel ‘Very’ Ready to Learn.
Graph 5: Pupils’ perception of PE and Active Lessons making them feel ‘Very’ Confident, Healthy and Ready to learn, by Sector.
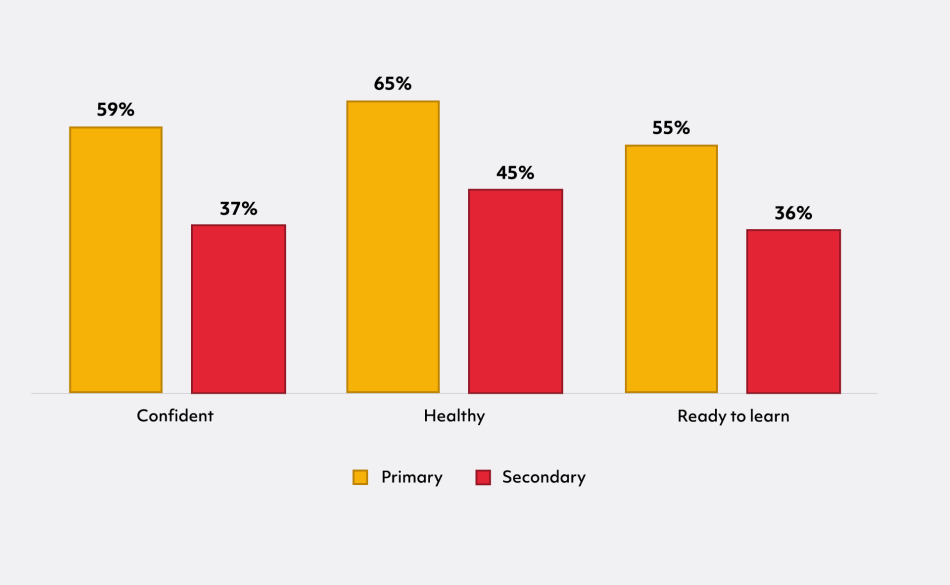
Description of graph 5
The percentage of pupils who said PE and Active lessons made them feel very confident was:
59% for primary school pupils
37% for secondary school pupils
The percentage of pupils who said PE and Active lessons made them feel very healthy was:
65% for primary school pupils
45% for secondary school pupils
The percentage of pupils who said PE and Active lessons made them feel very ready to learn was:
55% for primary school pupils
36% for secondary school pupils
The percentage of Secondary School pupils who said they feel ‘Very’ Confident, Healthy and Ready to Learn in PE and Active lessons was lower than of Primary School pupils.
- A 22-percentage-point difference exists between the percentage of Primary and Secondary pupils who said they feel ‘Very’ Confident
- A 20-percentage-point difference exists between the percentage of Primary and Secondary pupils who said they feel ‘Very’ Healthy
- A 18-percentage-point difference exists between the percentage of Primary and Secondary pupils who said they feel ‘Very’ Ready to Learn
4.3 Pupil demand for sport
On average, pupils reported a demand for 10 sports.
These include sports pupils already take part in and would like to do more often, as well as sports they do not currently take part in but would like the opportunity to try.
The most common sports pupils said they wanted to do more of were:
- 39% (119,000) of pupils want to do more Swimming
- 38% (117,000) of pupils want to do more Football
- 31% (96,000) of pupils want to do more Running or Jogging
- 30% (92,000) of pupils want to do more Trampolining
- 29% (89,000) of pupils want to do more Tennis
- 28% (86,000) of pupils want to do more Dodgeball
84% of pupils reported having a demand for sports they don’t already do, which is equivalent to 256,000 pupils. The most common sports pupils said they would like to do, but do not already participate in were:
- 19% (58,000) of pupils have unmet demand for Trampolining
- 15% (45,000) of pupils have unmet demand for Target Shooting
- 14% (44,000) of pupils have unmet demand for Archery
- 14% (43,000) of pupils have unmet demand for Boxing
- 14% (43,000) of pupils have unmet demand for Ice Skating
- 14% (42,000) of pupils have unmet demand for Rock Climbing or Bouldering
5. Enjoyment: How do pupils feel when taking part in sport
The vision focuses on creating a wide range of positive experiences so everyone can enjoy sport. This section examines the data on pupil opinion of their sporting experiences, as well as staff views on physical activity provision.
5.1 Enjoyment of sport, by setting
Pupils told us how much they enjoyed doing sport in each setting, from ‘A lot’ to ‘Not at all’
- 51% (143,000) of pupils said they enjoyed sport in PE and Active Lessons ‘A lot’
- 31% (87,000) of pupils said they enjoyed sport in School Sport Clubs ‘A lot’
- 55% (157,000) of pupils said they enjoyed sport in Community Sport Clubs ‘A lot’
- 51% (145,000) of pupils said they enjoyed sport in Other Settings, like the Park or Garden, ‘A lot’
5.2 Confidence in sport
Pupils also told us about how they feel in different situations, from ‘Very confident’ to ‘Not at all confident’:
- 45% (127,000) of pupils said they were ‘Very Confident’ to learn a new skill
- 35% (99,000) of pupils said they were ‘Very Confident’ to try a new sport
- 36% (102,000) of pupils said they were ‘Very Confident’ to try a sport in a new place
- 42% (119,000) of pupils said they were ‘Very Confident’ to try again when sport is hard
5.3 What would help pupils do more sport?
Pupils told us what would help them do more sport. Pupils could select more than one answer.
- 59% (166,000) of pupils said they would do more sport if there were more sports they liked
- 32% (90,000) of pupils said they would do more sport if they felt more confident
- 22% (62,000) of pupils said they would do more sport if they felt more comfortable
- 21% (60,000) of pupils said they would do more sport if it was easier to take part
- 20% (56,000) of pupils said they would do more sport if they felt more motivated
- 12% (34,000) of pupils said they would do more sport if they had what they needed or it cost less
- 13% (36,000) of pupils said none of these reasons would help them do more sport, and 7% (20,000) said other reasons would help them do more sport.
5.4 What is most important to pupils when they do sport?
Pupils told us what is most important to them when they do sport. Pupils could select more than one answer.
- 80% (223,000) of pupils said having fun was most important
- 61% (171,000) of pupils said being with friends was most important
- 50% (140,000) of pupils said improving their skills was most important
- 41% (115,000) of pupils said feeling confident was most important
- 30% (82,000) of pupils said winning was most important
- 26% (74,000) of pupils said liking their coach or teacher was most important
- 26% (73,000) of pupils said feeling safe was most important
- 17% (48,000) of pupils said access to good equipment and facilities was most important
- 2% (7,000) said none of these were most important to them, and 2% (6,246) said other reasons were most important to them.